Observability Component
Musings: On Observability in Overseer (March 21st, 2026)
This is a weird one. I don't see this as a true replacement for the Logfire UI, but they do give enough useful info to warrant a spot in Overseer. I just have to find the balance.
Distributed tracing, metrics, and log correlation with Pydantic Logfire. Auto-instruments your application and adapts to whichever components you have enabled.
Adding Observability to Your Project
What Observability Adds
When you include the observability component, your project gets:
- Pydantic Logfire integration with automatic configuration
- FastAPI instrumentation: traces every request (health/dashboard endpoints excluded)
- HTTPX instrumentation: traces outbound HTTP calls
- SQLAlchemy instrumentation: auto-enabled when the database component is present
- Redis instrumentation: auto-enabled when the redis component is present
- Health check integration with the Overseer dashboard, including Logfire Query API analytics
- Dashboard card + detail modal with trace metrics, slowest spans, and exception tracking
- Graceful degradation: works without a cloud token (local instrumentation only)
Generated Files
my-project/
├── app/
│   └── components/
│       ├── backend/
│       │   └── middleware/
│       │       └── logfire_tracing.py    # Auto-discovered Logfire middleware
│       └── frontend/
│           └── dashboard/
│               ├── cards/
│               │   └── observability_card.py   # Overseer dashboard card
│               └── modals/
│                   └── observability_modal.py  # Detail modal with tabs
└── .env.example                          # Updated with Logfire variables
How It Works
graph TB
    subgraph "Application Startup"
        Hooks["Backend Hooks<br/>Auto-discovery"]
        MW["logfire_tracing.py<br/>register_middleware"]
    end

    subgraph "Instrumentation"
        FA["FastAPI<br/>Request tracing"]
        HX["HTTPX<br/>Outbound HTTP"]
        SA["SQLAlchemy<br/>Database queries"]
        RD["Redis<br/>Cache operations"]
    end

    subgraph "Logfire Cloud"
        Cloud["Logfire Dashboard<br/>Traces + Metrics"]
        QA["Query API<br/>Analytics"]
    end

    subgraph "Overseer Dashboard"
        Card["Observability Card<br/>Status + Metrics"]
        Modal["Detail Modal<br/>Spans + Exceptions"]
    end

    Hooks -->|discovers| MW
    MW --> FA
    MW --> HX
    MW -.->|if database| SA
    MW -.->|if redis| RD

    FA -->|LOGFIRE_TOKEN| Cloud
    HX -->|LOGFIRE_TOKEN| Cloud
    SA -->|LOGFIRE_TOKEN| Cloud
    RD -->|LOGFIRE_TOKEN| Cloud

    QA -->|LOGFIRE_READ_TOKEN| Card
    QA -->|LOGFIRE_READ_TOKEN| Modal
The middleware is auto-discovered by the backend hook system, no manual registration needed. On startup it configures Logfire with your project name and environment, then instruments each available integration.
When LOGFIRE_TOKEN is set, traces are sent to Logfire cloud. Without a token, instrumentation still runs locally (useful for development and structured logging).
Environment Variables
| Variable | Default | Description |
|---|---|---|
LOGFIRE_TOKEN |
- | Enables sending traces to Logfire cloud |
LOGFIRE_READ_TOKEN |
- | Enables Query API analytics in the Overseer dashboard |
LOGFIRE_PROJECT_URL |
- | Link to your Logfire project dashboard |
Set these in your .env file:
# Observability (Logfire)
LOGFIRE_TOKEN=your-write-token
LOGFIRE_READ_TOKEN=your-read-token
LOGFIRE_PROJECT_URL=https://logfire.pydantic.dev/myorg/myproject
Component Integrations
Observability automatically adapts its instrumentation based on which components are enabled in your project:
| Component | Integration | What Gets Traced |
|---|---|---|
| Backend (always) | logfire.instrument_fastapi() |
All HTTP requests (excludes /health/* and /dashboard/*) |
| HTTPX (always) | logfire.instrument_httpx() |
All outbound HTTP calls |
| Database | logfire.instrument_sqlalchemy() |
SQL queries via the shared engine |
| Redis | logfire.instrument_redis() |
Redis commands and pub/sub |
This is handled at template generation time, the logfire[fastapi,httpx] dependency automatically includes extras like sqlalchemy and redis when those components are present.
Overseer Integration
The observability component integrates with the Overseer dashboard through a status card and a detail modal.
Dashboard Card
The card displays real-time Logfire status:
- With Query API (
LOGFIRE_READ_TOKENset): Shows trace count, exception count, average latency, and max latency for the last hour - Without Query API: Shows cloud connection status with a hint to add the read token
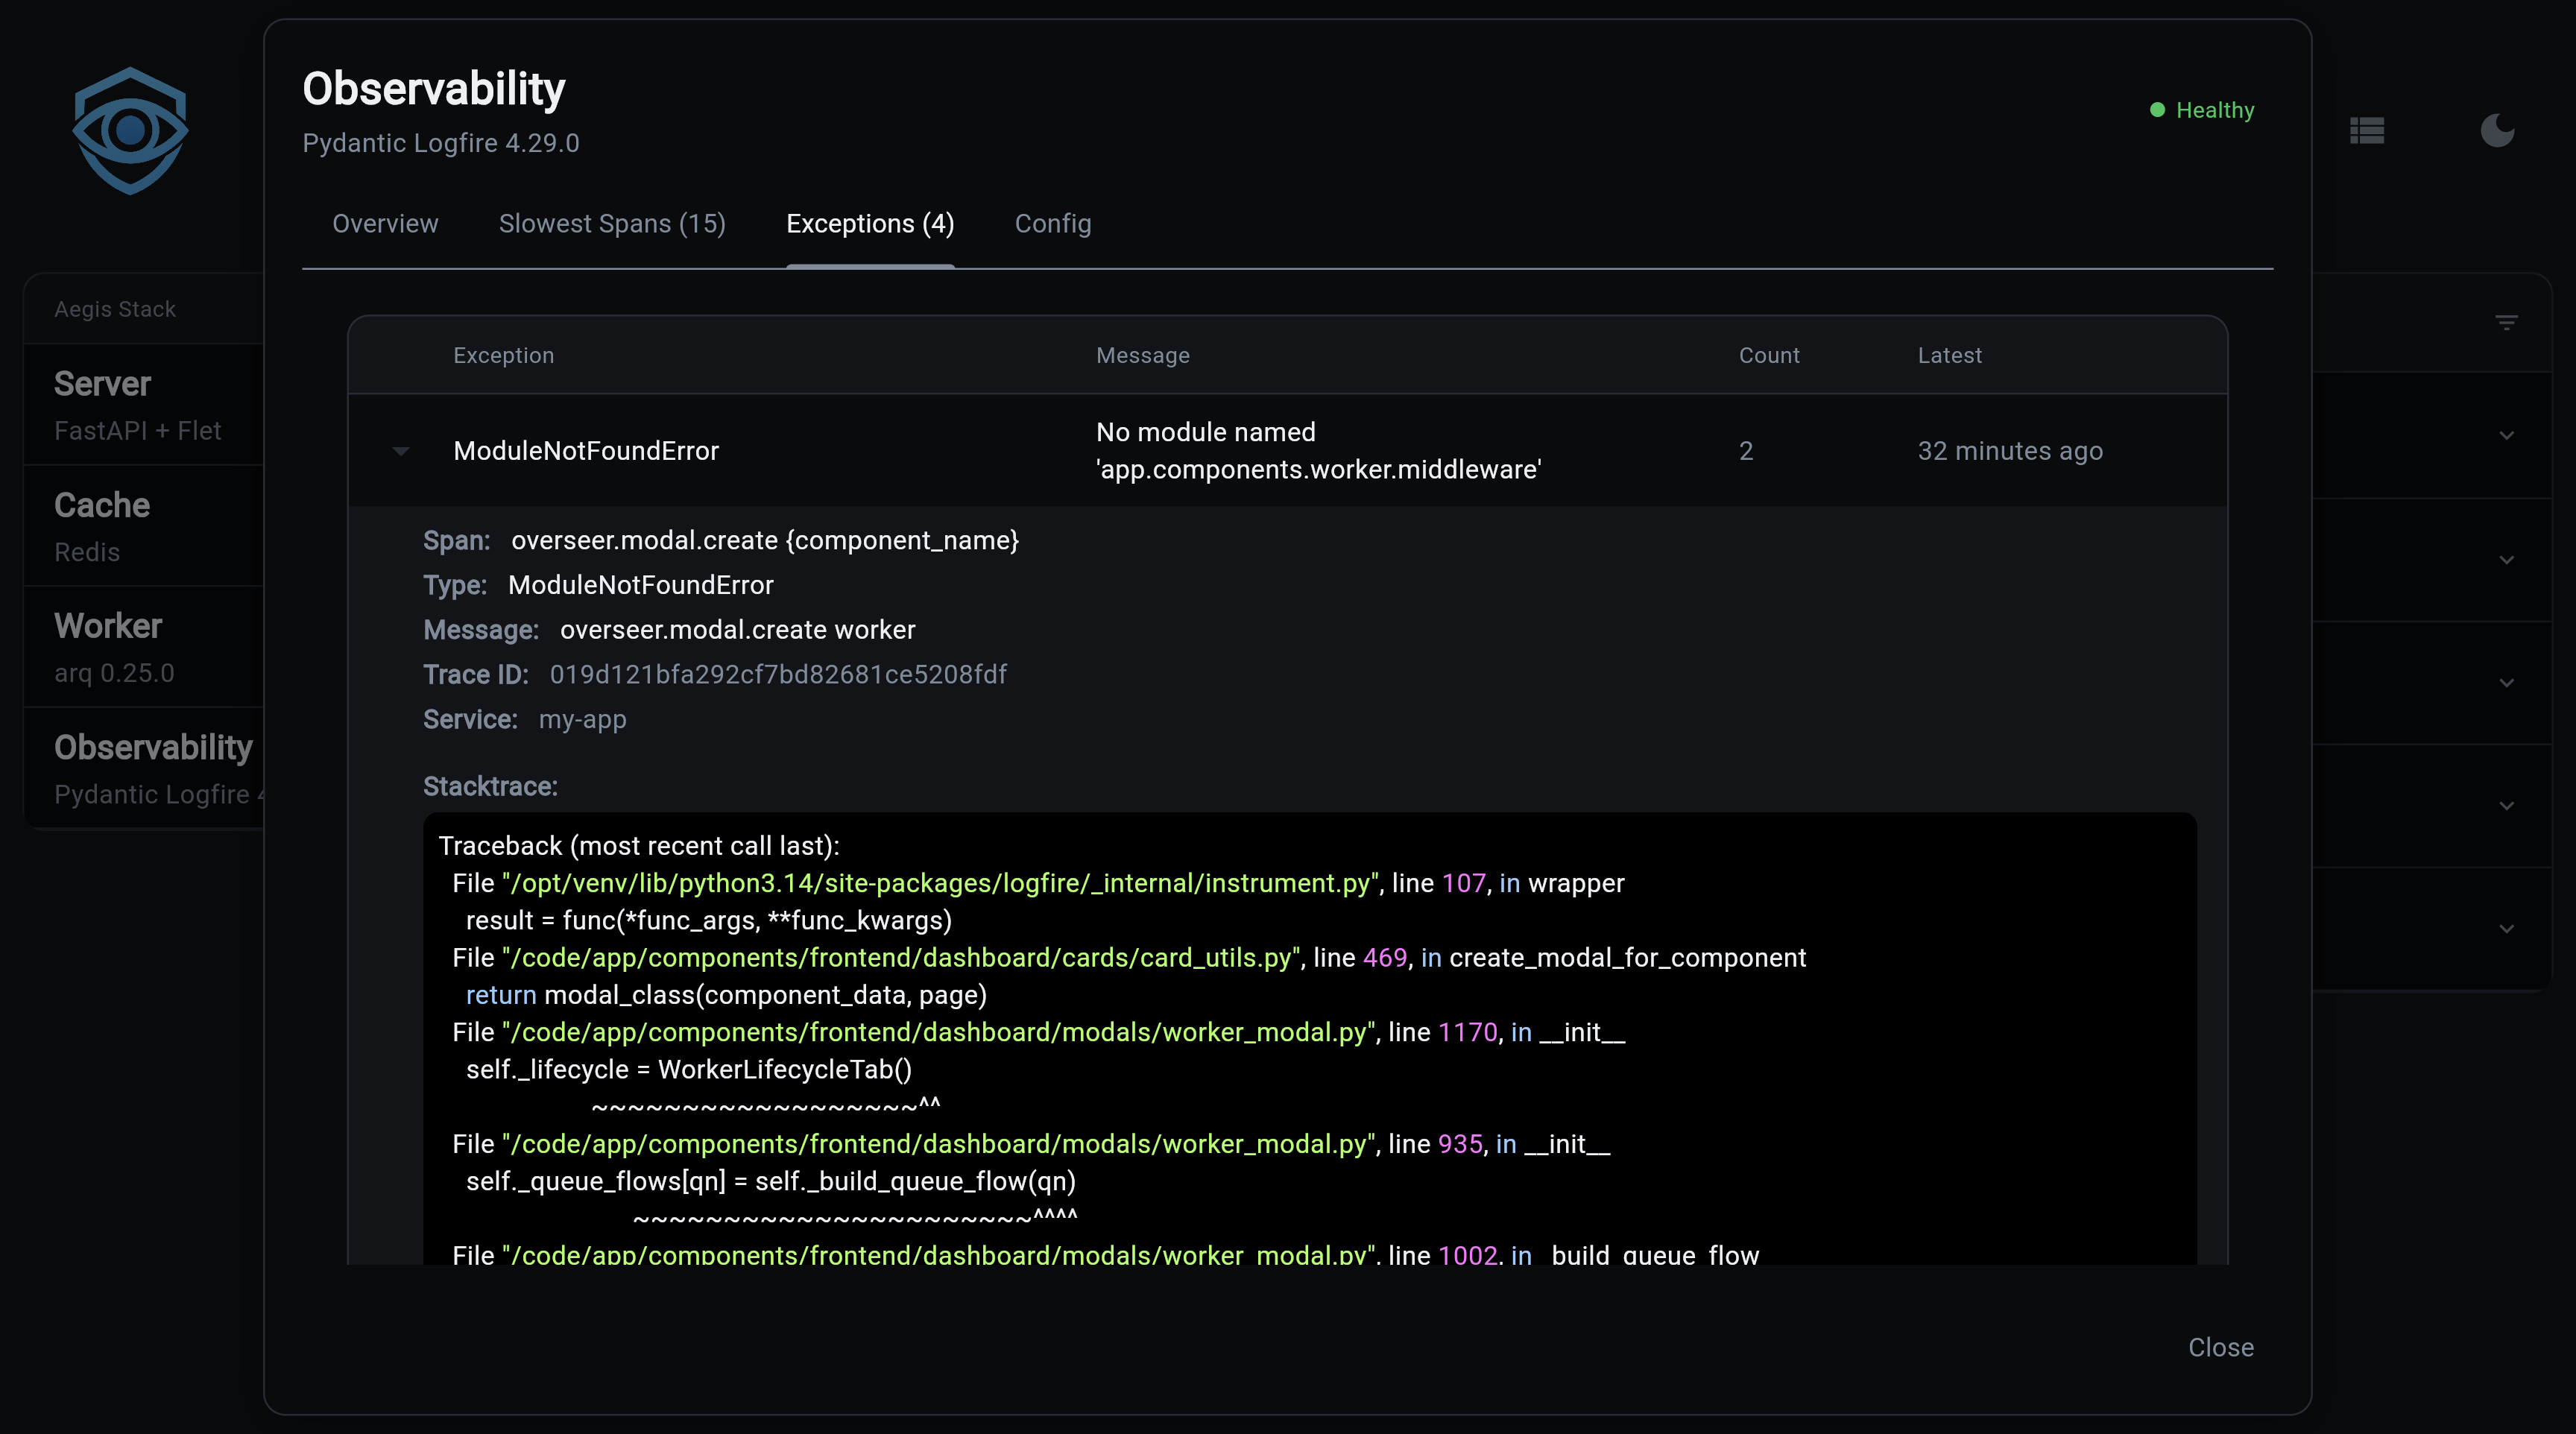
Detail Modal
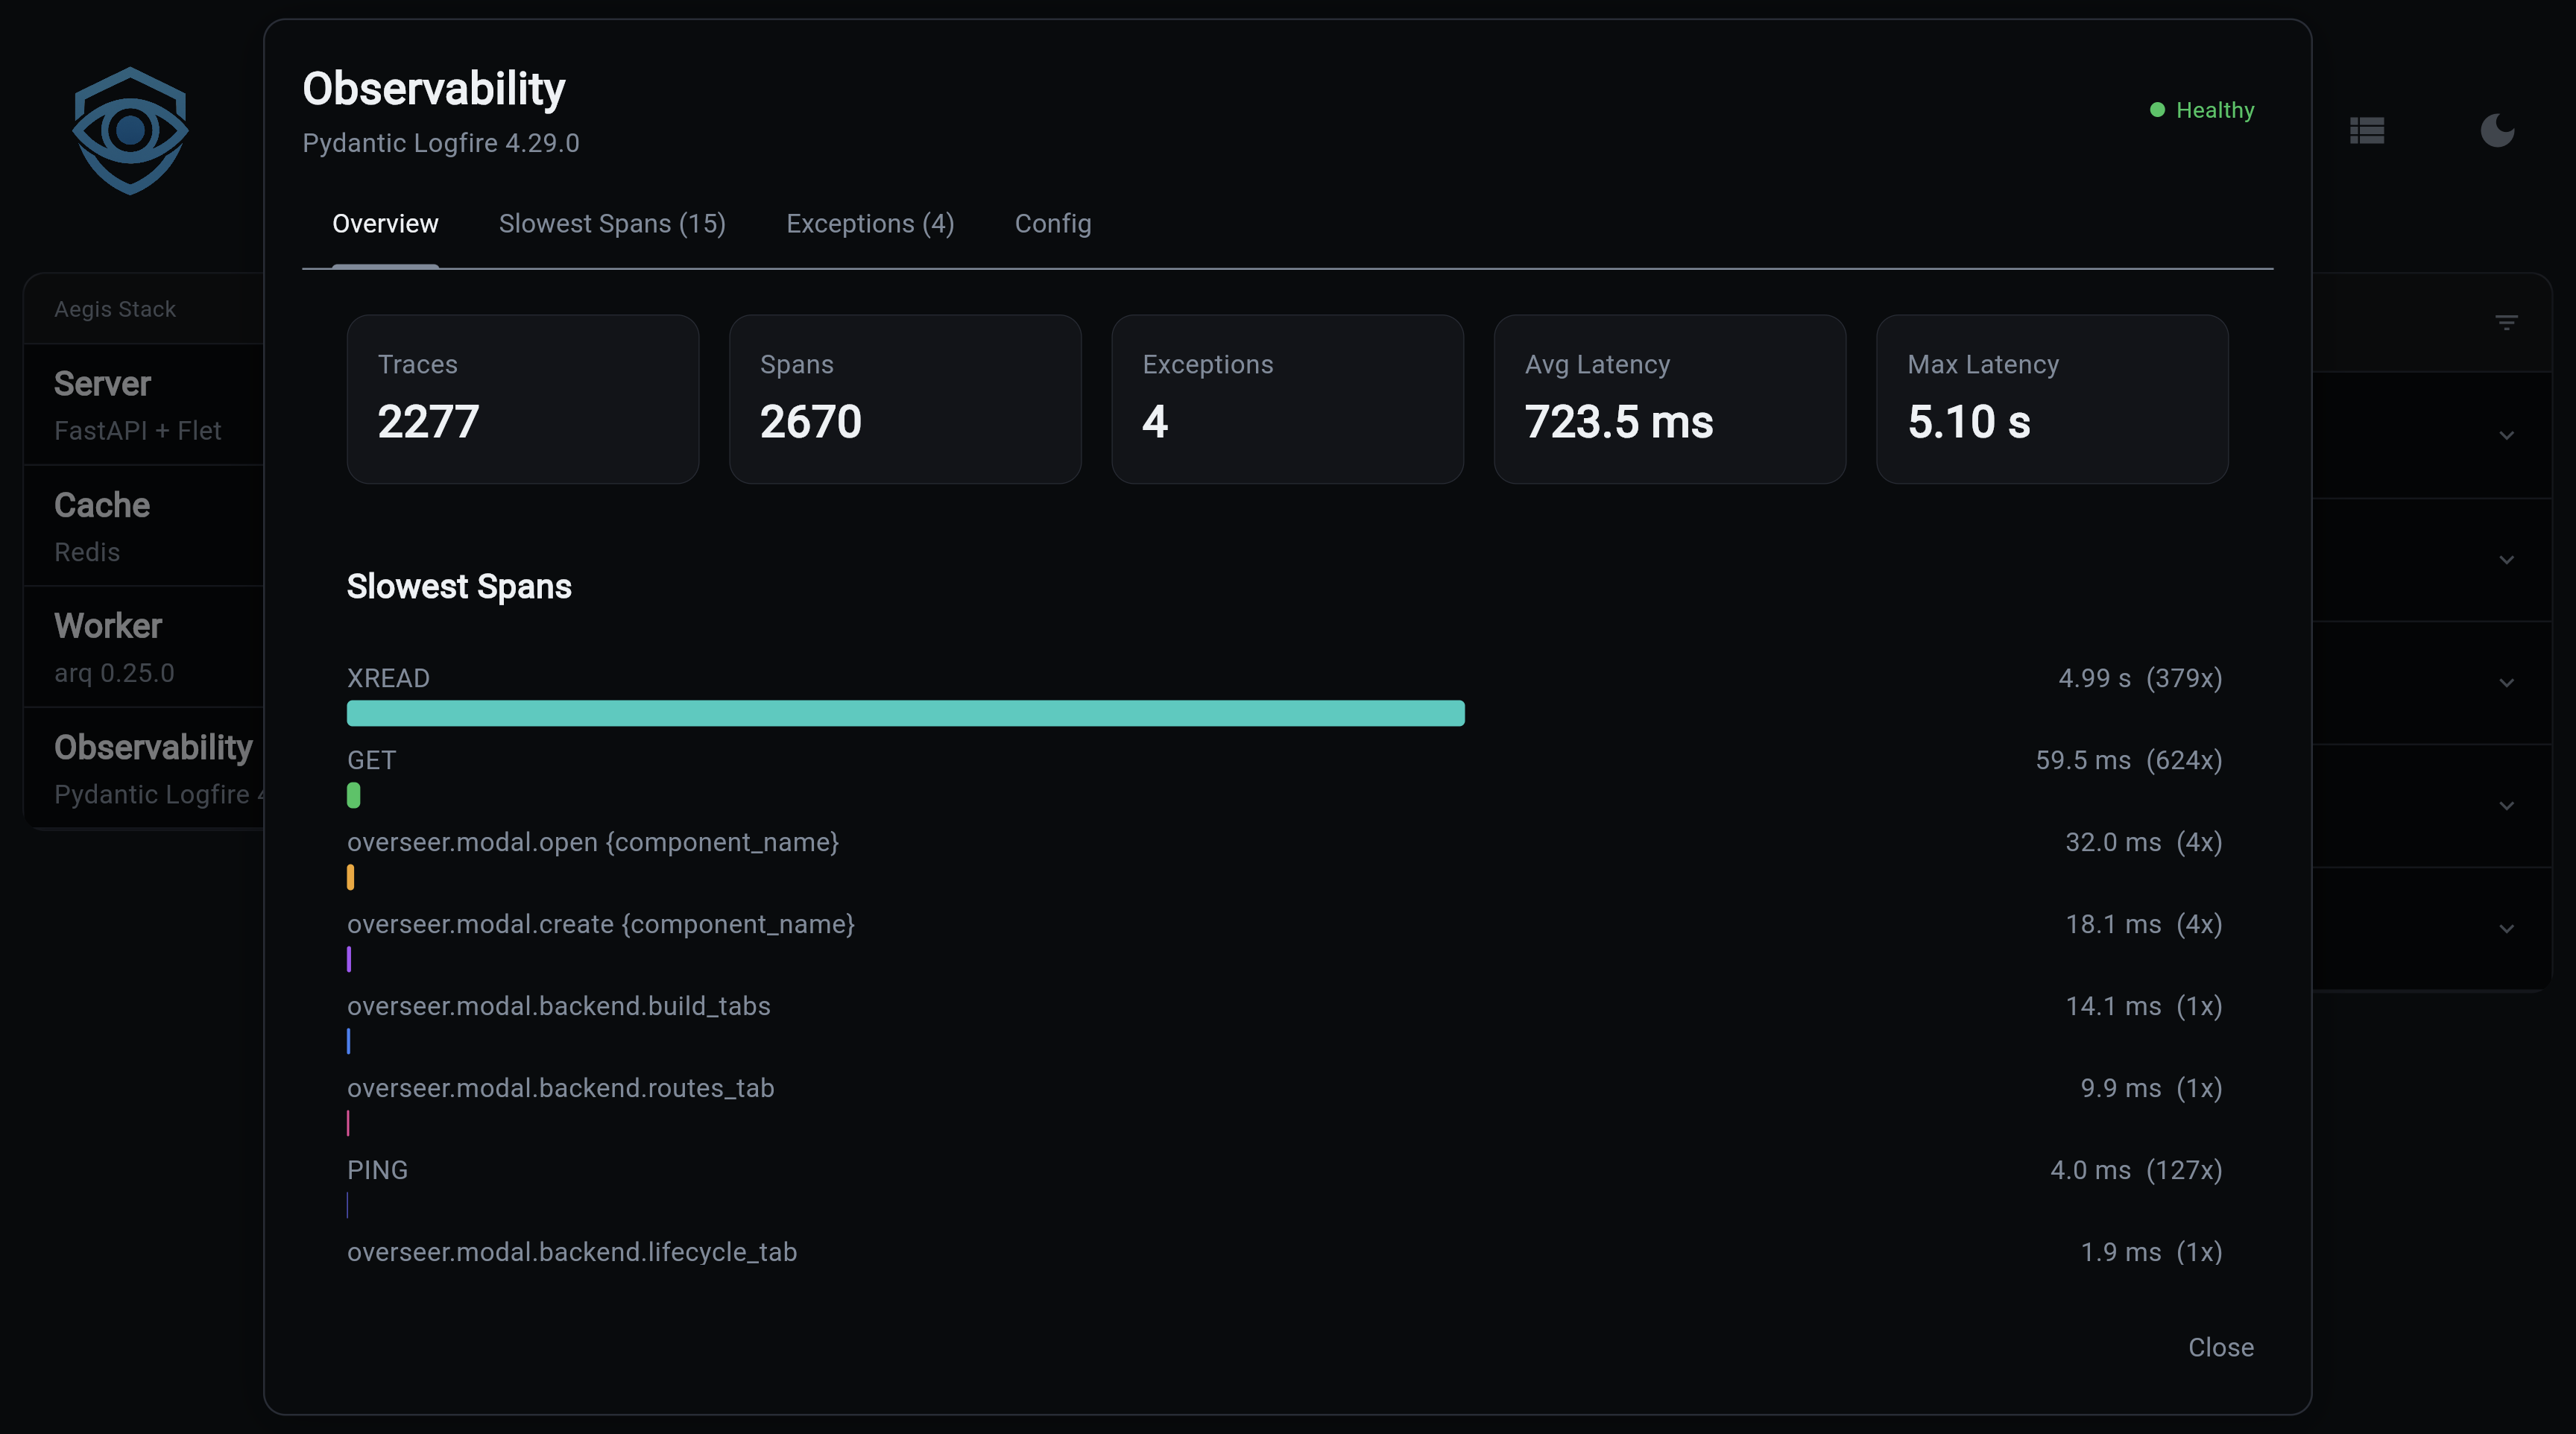
Clicking the card opens a detail modal with four tabs:
Overview, Key metrics (traces, spans, exceptions, latency) plus a bar chart of the slowest spans:
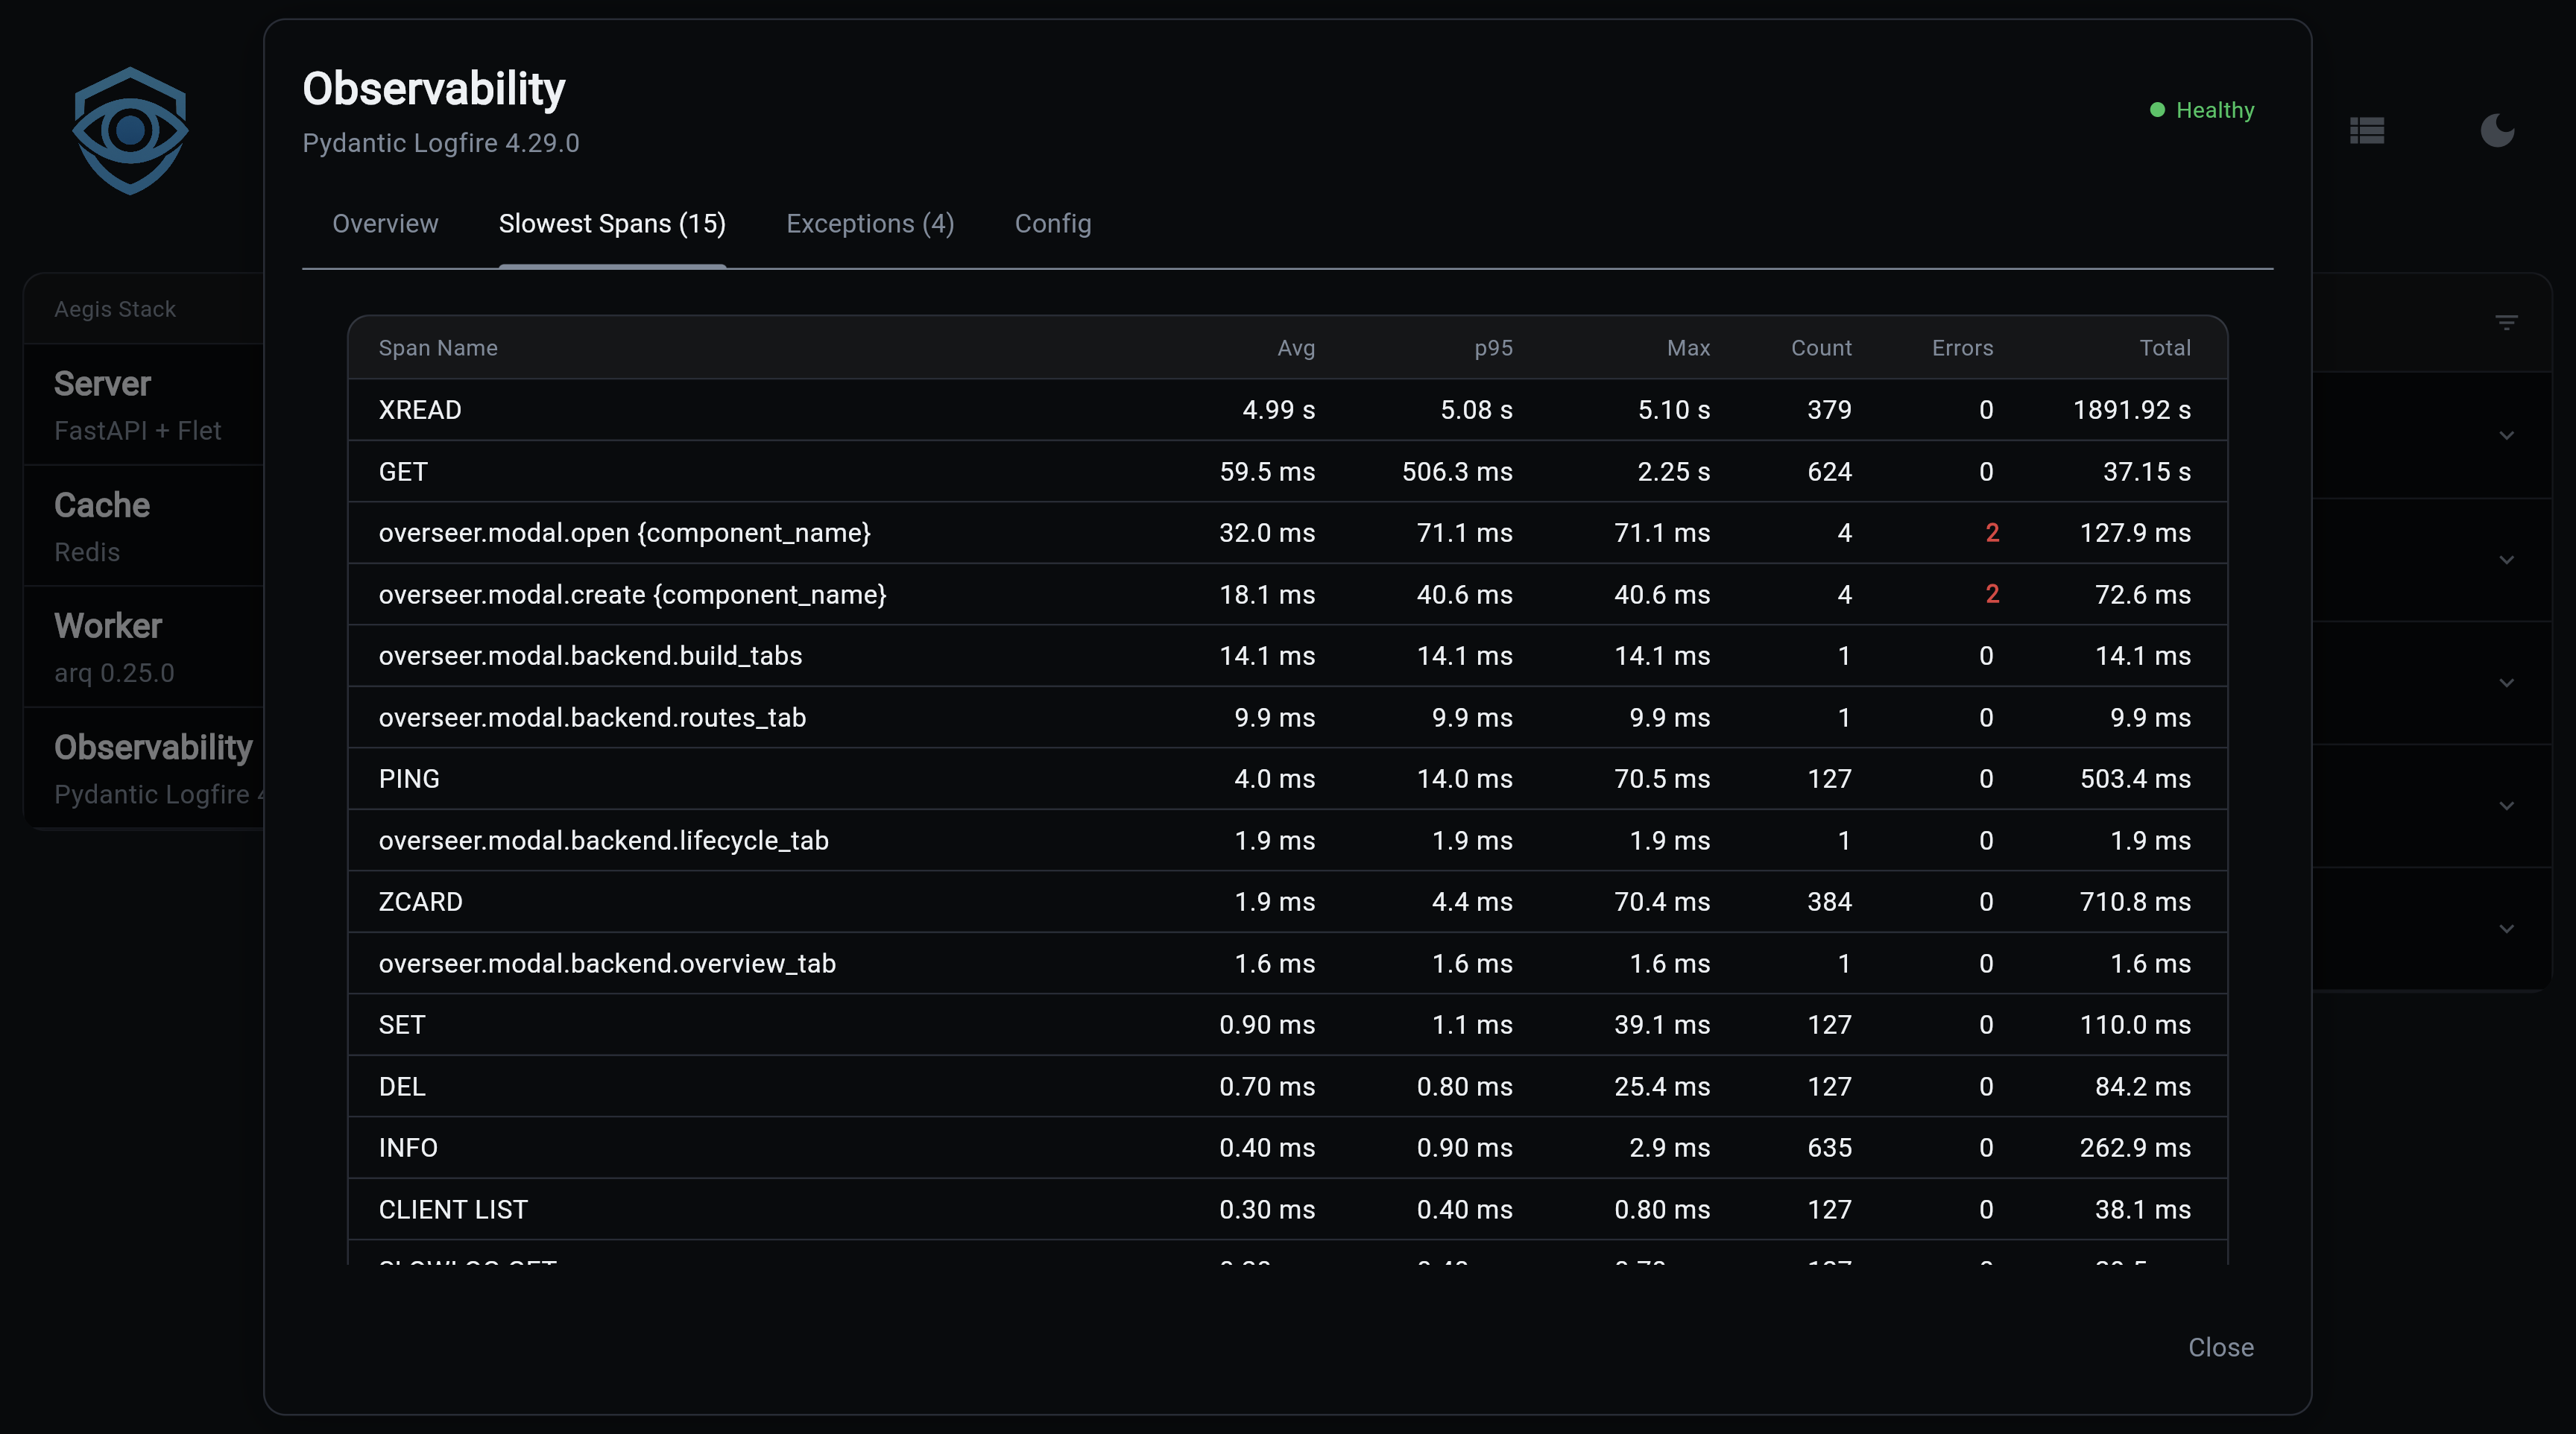
Slowest Spans, Full table with avg, p95, and max latency per span type, with error counts highlighted in red:
Exceptions, Expandable table of exceptions from the last 24 hours, grouped by type. Click to expand and see the full stack trace.
Config, Service name, cloud status, Query API availability, and project URL link
Health Check
The health check queries the Logfire Query API (when LOGFIRE_READ_TOKEN is set) and reports:
- Total spans and traces (last hour)
- Exception count
- Average and max latency
- Top 20 slowest spans
- Recent exceptions (last 24 hours)
Results are cached for 2 minutes with a 5-minute backoff on failure to respect rate limits.
Memory Footprint on Constrained Hosts
The OpenTelemetry SDK that Logfire builds on is heavy: even with send_to_logfire=False, loading the SDK and its in-memory span batcher adds ~150-300 MiB of fixed overhead. On a 512 MiB container that is the difference between healthy and OOM-flapping.
Two safeguards ship in the template:
-
No-token short-circuit. When
LOGFIRE_TOKENis empty, the middleware skipslogfire.configure()and everyinstrument_*()call. The OTEL SDK is never loaded. You see this in the logs asLogfire: token not set, instrumentation disabled. -
Bounded span buffer when the token is set. The
BatchSpanProcessordefaults (2048-span queue, no export timeout) leak when the Logfire endpoint is slow or unreachable, failed batches accumulate in RAM until OOM. The template caps them via fourOTEL_BSP_*settings pushed intoos.environbeforelogfire.configure()runs. Override via.envif you have headroom:
# OTEL_BSP_MAX_QUEUE_SIZE=1024
# OTEL_BSP_MAX_EXPORT_BATCH_SIZE=256
# OTEL_BSP_EXPORT_TIMEOUT=10000
# OTEL_BSP_SCHEDULE_DELAY=5000
Swap on small droplets
For hosts with 4 GB RAM or less, add a 1 GB swap file as a safety net so a brief memory spike does not OOM-kill the webserver before the cgroup limit kicks in:
fallocate -l 1G /swapfile && chmod 600 /swapfile && mkswap /swapfile && swapon /swapfile
echo '/swapfile none swap sw 0 0' >> /etc/fstab
Next Steps
- Component Overview, Understanding Aegis Stack's component architecture
- Integration Patterns, How components work together
- Pydantic Logfire Documentation, Complete Logfire reference