Logs and Errors
Every part with a container behind it has a Logs section on its own page. Overseer > Logs and Overseer > Errors gather them all in one place.
Logs
Open Logs at /overseer/logs. The Services checklist includes installed
application services alongside runtime components and containers. Select AI,
Auth, or several services to see their attributed logs across containers;
combined selections include any matching service or container. The same filter
applies to history, live updates, and the volume chart. Rows show the application
service alongside its runtime, for example AI · Worker.
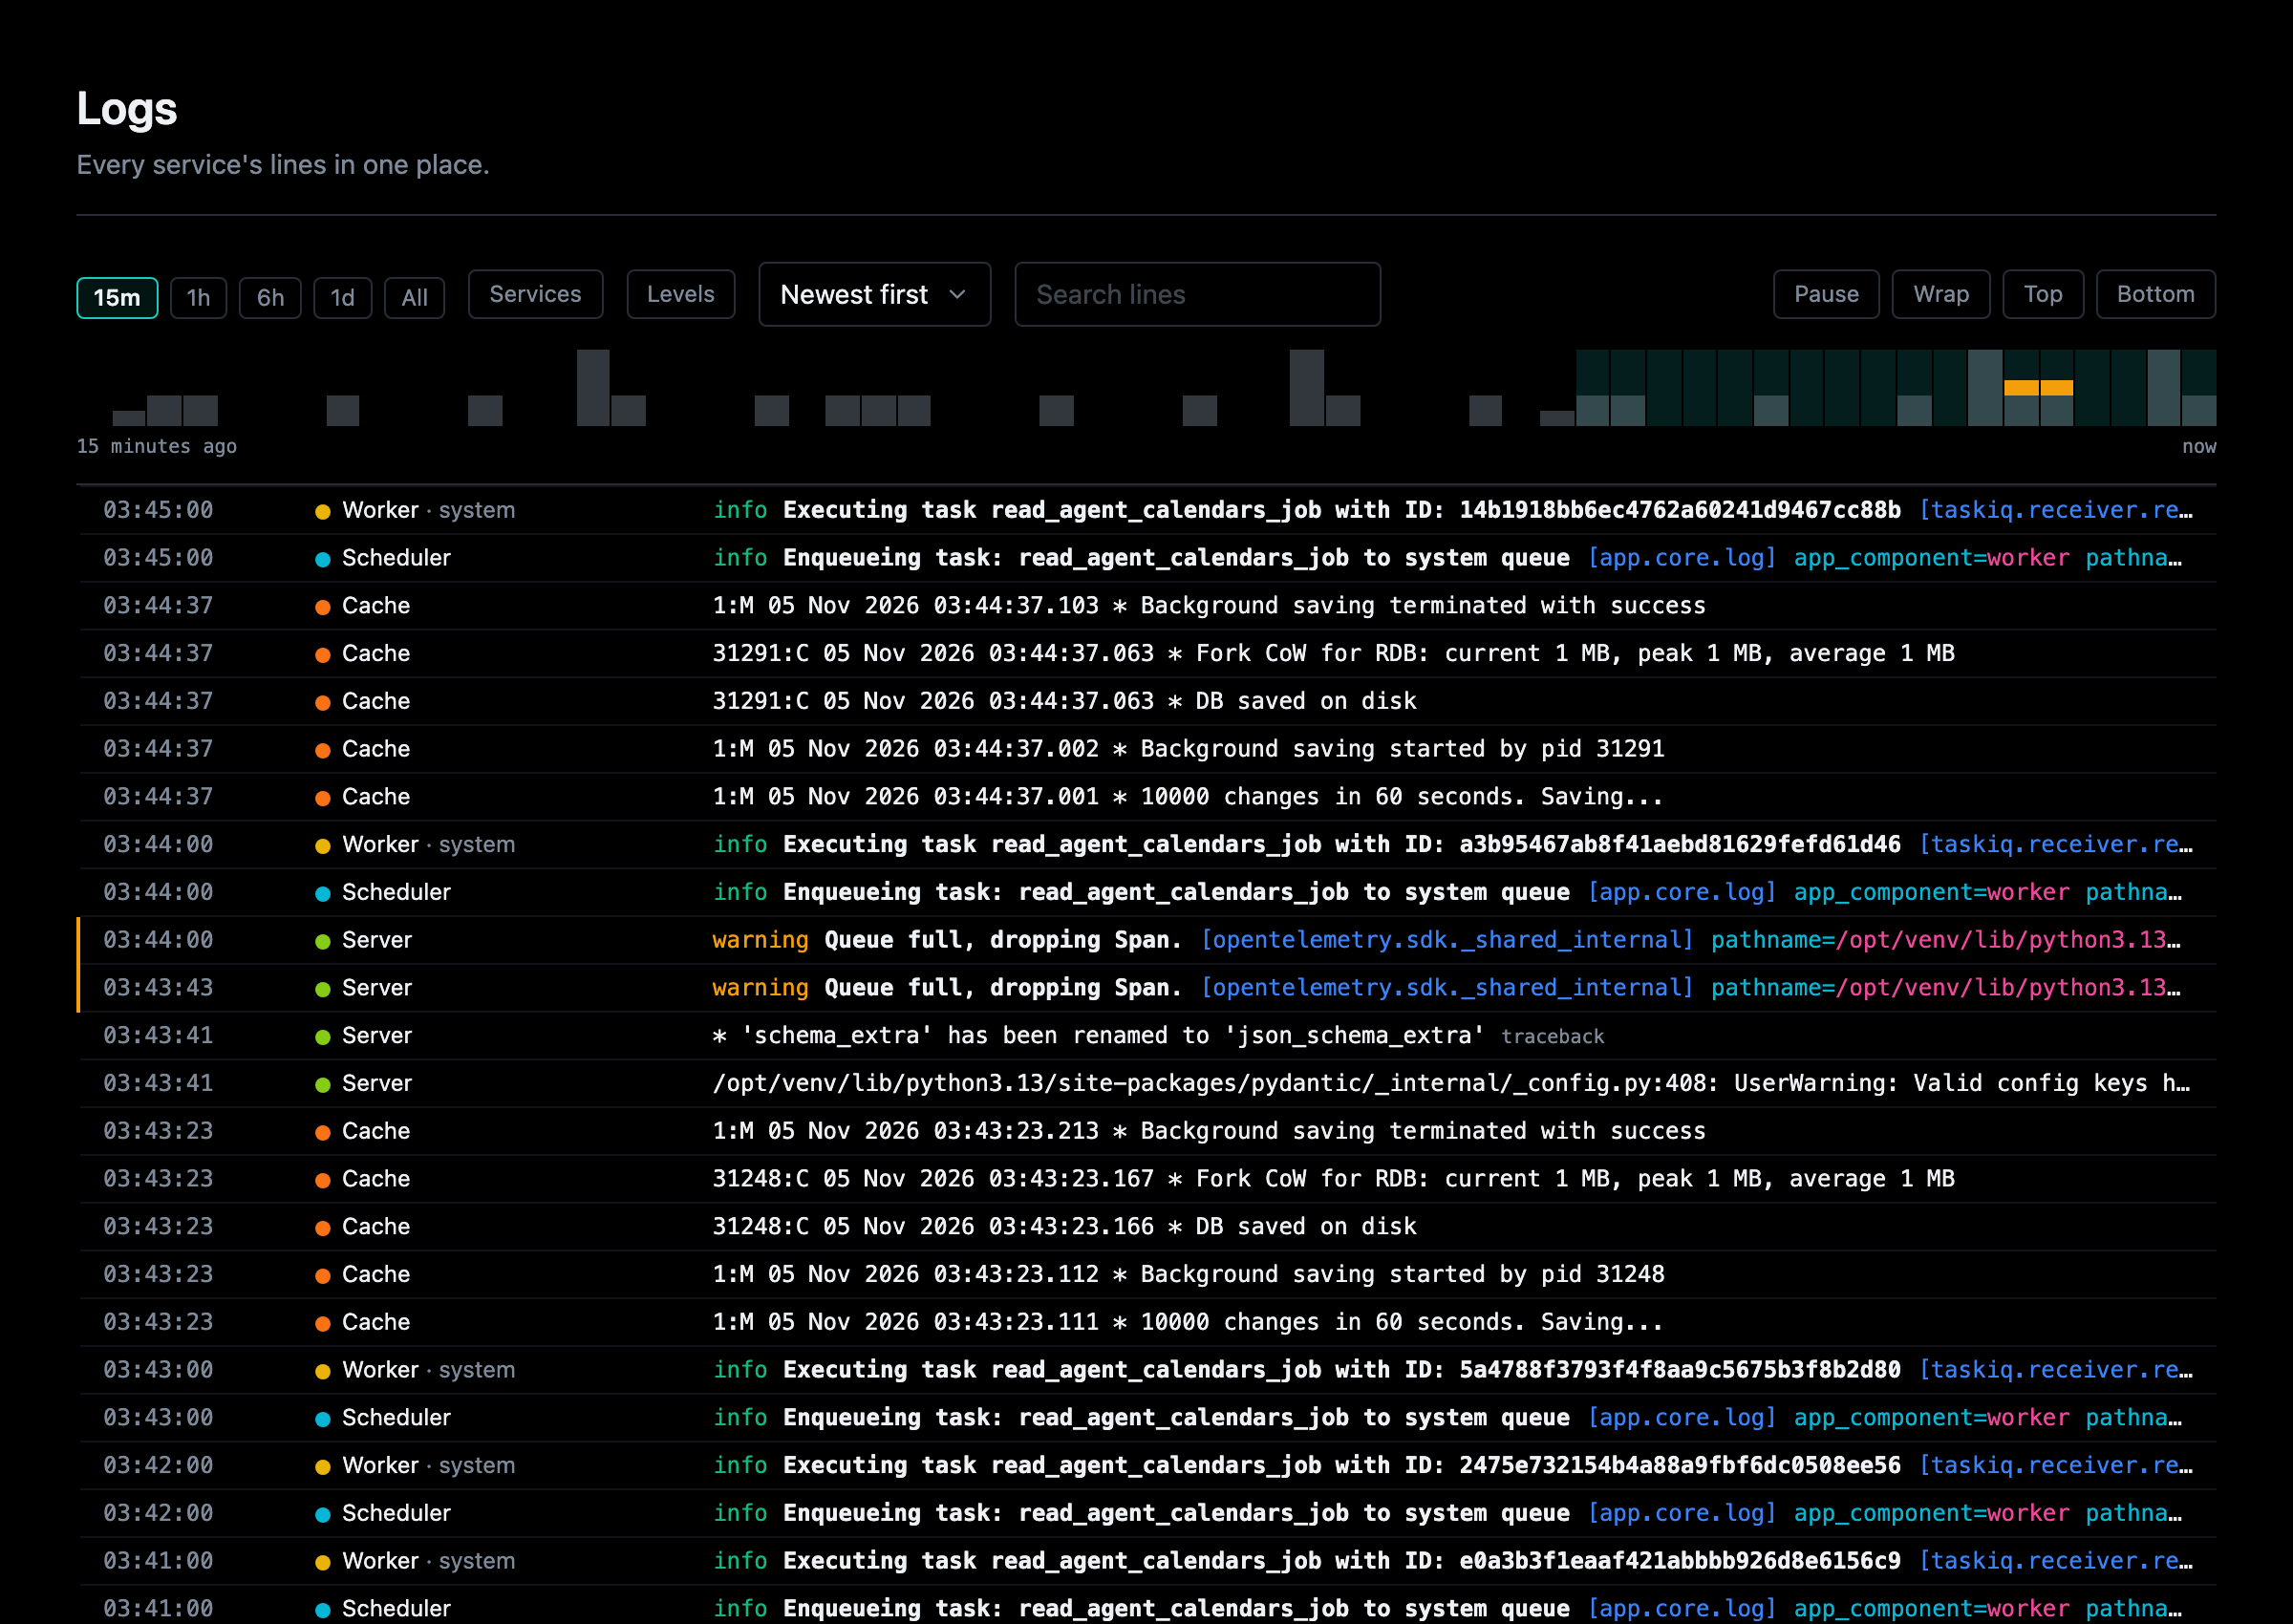
Components are in the checklist too, as their code (Worker code, Cache
code), apart from the runtimes above them: a line written or raised in a
component's own code names it.
Normal logs use the same automatic attribution as errors. Older lines without attribution remain available under their runtime/container or with all filters cleared. Logs come from Docker, and new lines are pushed while the page is open; no additional Redis pipeline is used. A traceback names the first line of the app's own code it passed through, linked to Code.
Errors
Open Errors beside Logs, or go directly to /overseer/errors. Collection runs
in the webserver background even when every browser is closed. It needs Redis
and the Docker runtime; minimal stacks still render the page with an explanation
when collection is unavailable.
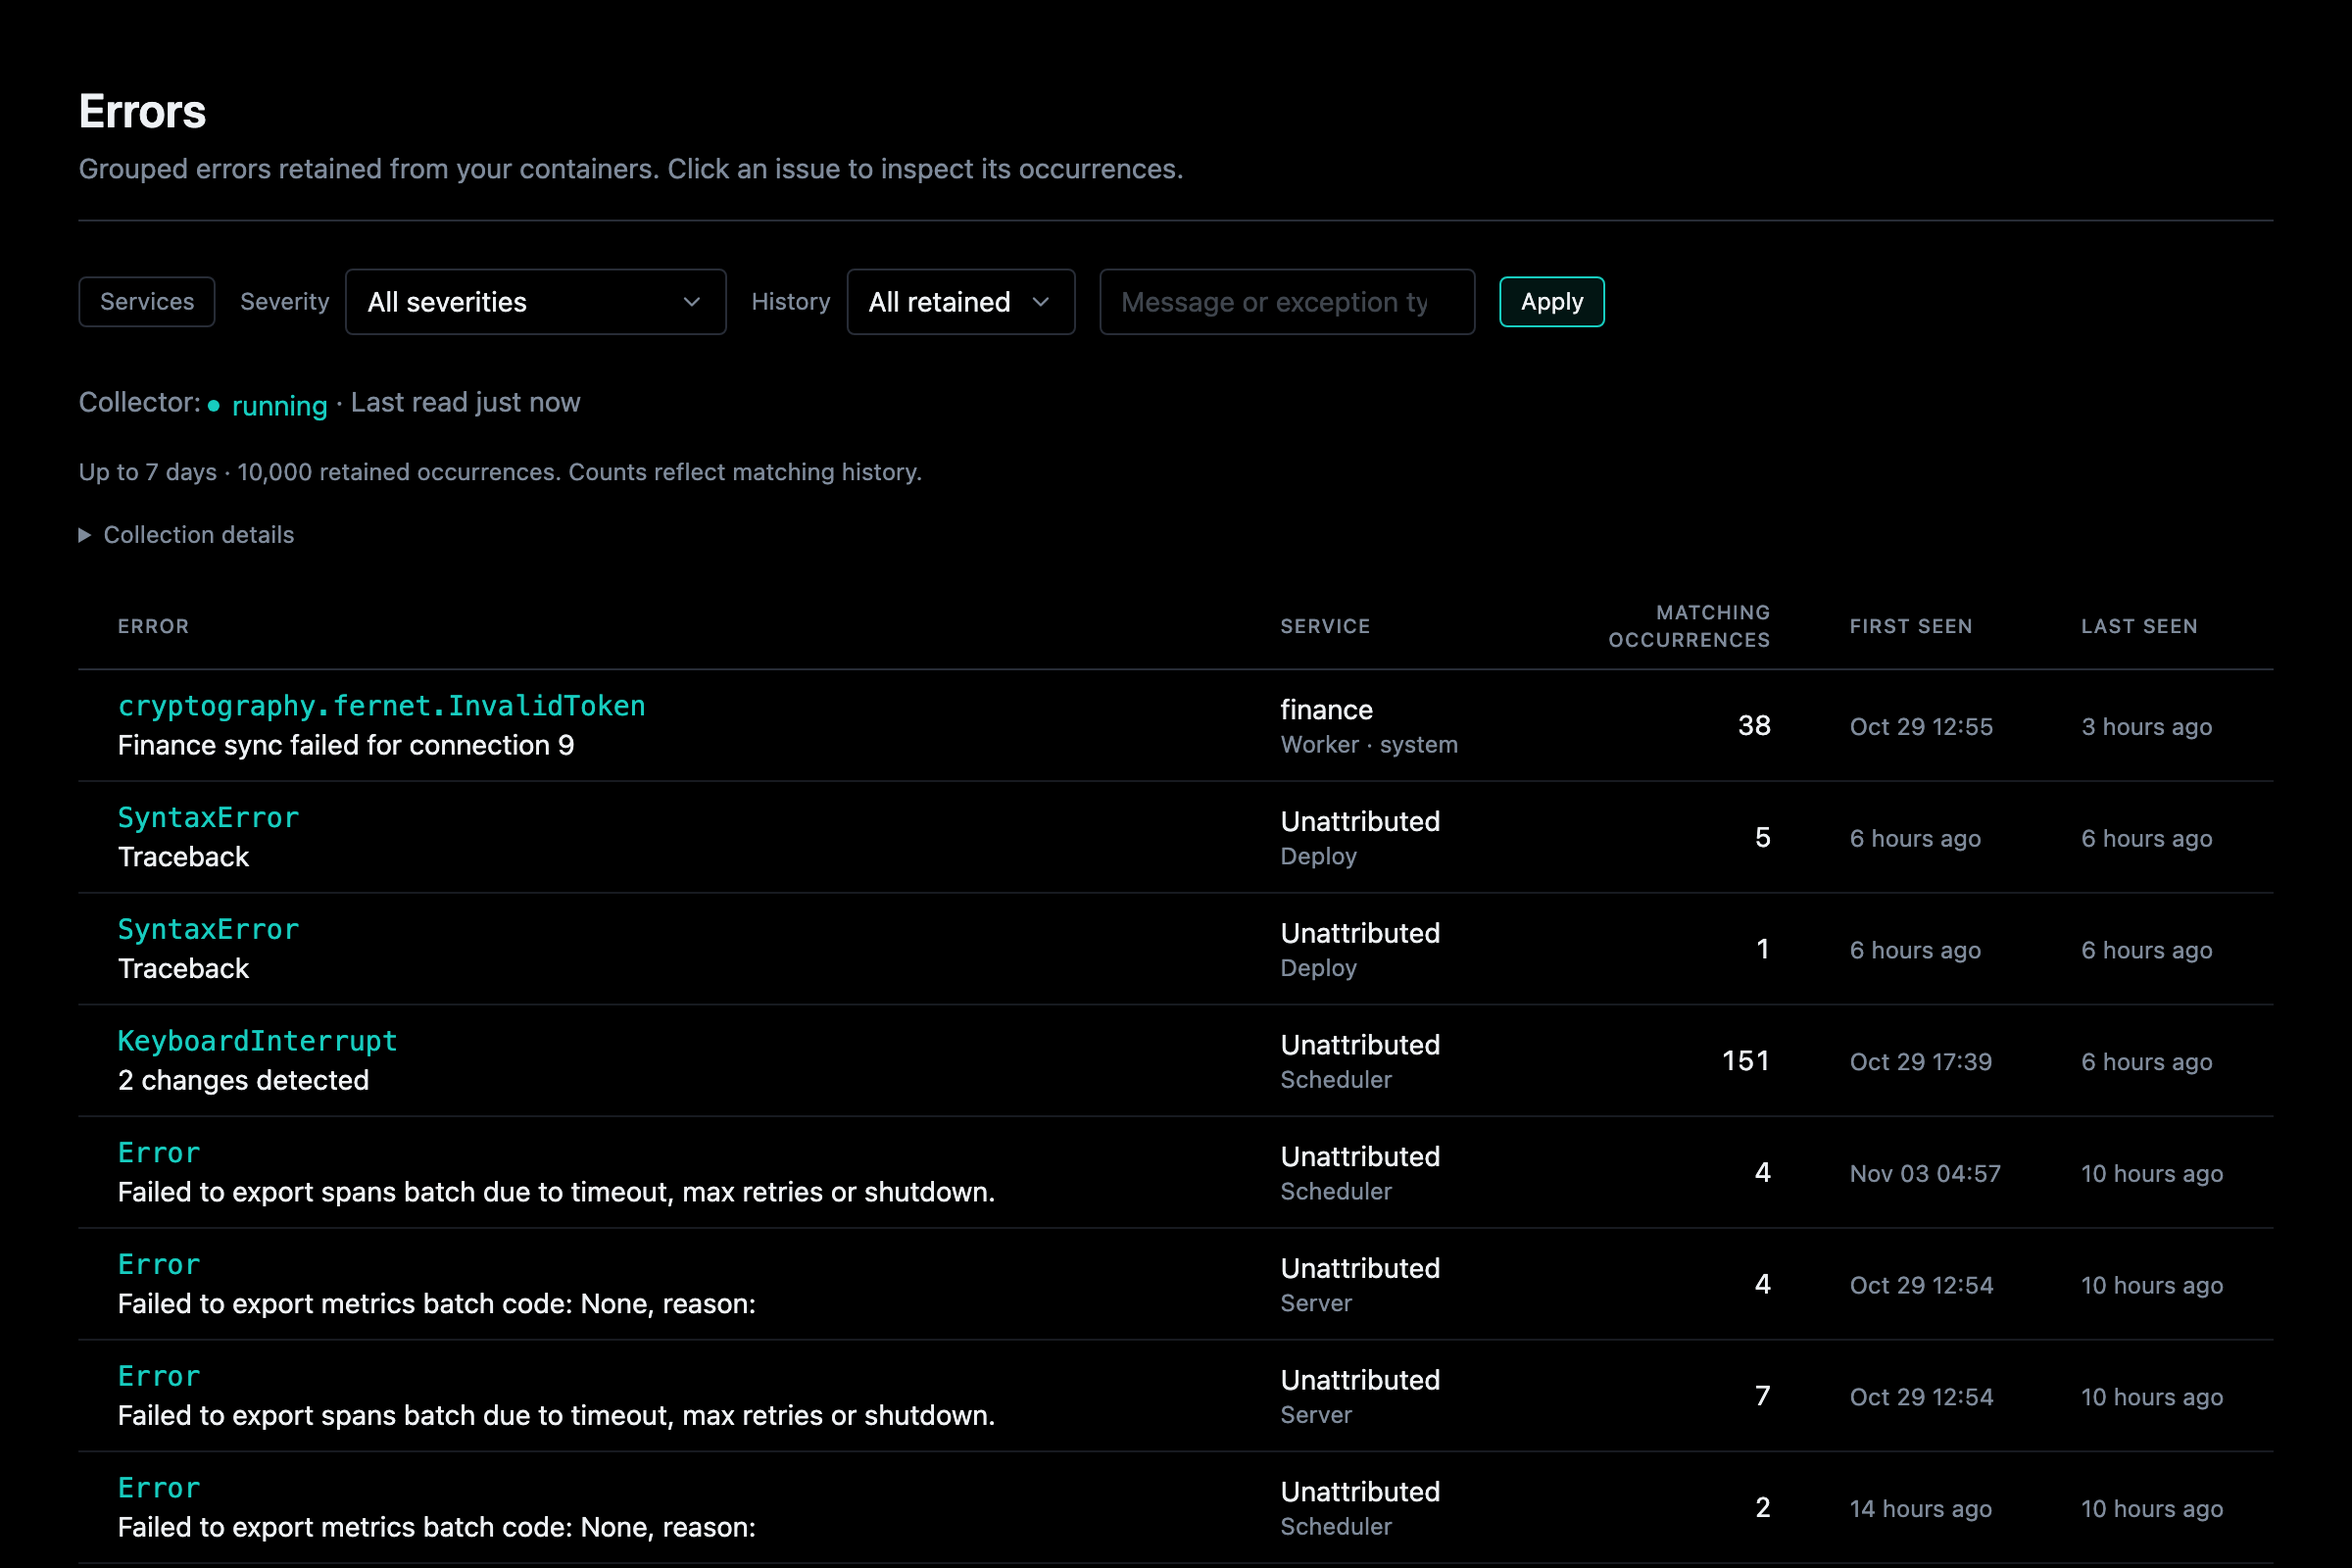
The list groups explicit ERROR/CRITICAL messages and recognized exceptions by service and cause. Click an issue to open the side drawer and inspect the selected occurrence, its container, timestamp, level, safe structured fields, and stored stack trace. Use the occurrence links to inspect older traces, or copy the selected trace. An error without a stack trace cannot have one reconstructed from its message. Detail URLs are bookmarkable; detail remains stable while the list updates.
The drawer opens with In your code: every frame of the stack trace in the
app's own code (app/...), where it broke first, each a link to its line in
Code. In the trace itself those frames are links too, and a
library's frames are dimmed. An error logged during a request links to that
request's replay.
The Services checklist is the one Logs uses, so a filter carries between the two
pages. No selection means every source; an error from any selected runtime,
container or application service is shown, and an application service matches its
attributed errors across containers. The Service column shows the application
service above the runtime, named as Logs names it (Worker · system).
Logs without service evidence remain Unattributed.
Severity, history, and search filters apply to retained occurrences
before grouping and pagination. Counts and first/last times describe the matching
retained occurrences, not lifetime error totals. Detail history shows all retained
occurrences of the issue. Search covers exception type and the first 1,024 message
characters across the retained index (up to 10,000 occurrences), not only the
current page. The Logs link opens the service's last hour of logs; stored detail
survives Docker log rotation even when those source logs are no longer available.
Live updates use independent Redis notification readers for each viewer and replace the grouped list. A reconnect rebuilds from retained state, including after notification trimming. Server reconciliation every 15 seconds removes quietly expired results. An open occurrence is preserved until navigation.
How errors are collected and credited to a service: How errors are collected, How a line names its service.
How errors are collected
The backend's startup/error_tracking.py starts the collector through the shared
background task registry. The matching shutdown hook cancels and awaits pumps,
releases its lease when possible, and closes its Redis client. One 20-second
Redis lease per project fences writes from superseded collectors. Discovery and
lease renewal run every five seconds. Each running container on a known runtime
page has an independent stream; workers are supported without importing worker
modules. Sources reconnect with exponential backoff, capped at 30 seconds.
A container that runs out of memory writes no line for it: the kernel kills a
process in it. With the deploy component, the collector also reads Docker's
oom events for the project's containers and records each as an error
("ran out of memory") on that container's page. It reads back over the
retention window, as far as Docker still holds them, so a webserver that ran
out, and restarted with the collector in it, still shows what happened.
| Setting | Default | Meaning |
|---|---|---|
ERROR_TRACKING_ENABLED |
true |
Enable background collection |
ERROR_TRACKING_RETENTION_SECONDS |
604800 |
Maximum retained age: seven days |
ERROR_TRACKING_MAX_OCCURRENCES |
10000 |
Total retained occurrences per project; maximum 10,000 |
ERROR_TRACKING_MAX_BYTES |
16777216 |
Bytes the retained occurrences may take in Redis (16 MB); the oldest go first past it |
ERROR_TRACKING_MAX_SOURCES |
64 |
Concurrent container streams; maximum 256 |
Keys use aegis:errors:<hash-of-PROJECT_NAME>: and notifications use
aegis:events:errors:<hash-of-PROJECT_NAME>. Projects sharing Redis must use
distinct PROJECT_NAME values. Redis keyspace ownership is declared by the
repository and appears on Overseer's Redis page. History uses hashes and sorted
indexes; notifications are hints, capped at approximately 10,000 stream entries.
An occurrence is capped at 64 KiB including serialized JSON escaping. Each source assembler holds at most 48 KiB per stdout/stderr record; the Docker stream decoder bounds unfinished input to 1 MiB. Writes are awaited to apply backpressure. Search metadata is bounded separately. Retention removes records, search metadata, and indexes together in batches of at most 128 per atomic operation, yielding between batches. Cleanup runs within one discovery tick plus batch processing time; reading never writes. Empty issue indexes disappear. With no filter, the list reads per-issue summaries each write keeps current; any filter reads the search metadata once and groups it. Active source cursors are removed when their containers leave discovery; lease and shared health status expire automatically.
Replay identity retains Docker's original nanosecond timestamp and per-stream ordinal, including non-error input. A source's position is saved at most once a second, and reconnect re-reads the second before it; occurrence IDs absorb the overlap. A fixed-size discarded-history watermark prevents count-pruned records from returning on replay. Late inputs at or before that boundary, including timestamp ties, are conservatively dropped and counted.
Recovery is best effort within Docker log retention, not a durable capture or exactly-once promise. The restricted proxy does not expose exact restart incarnations; container ID plus timestamp identify restart input. Rotation, missing source timestamps, unfinished traces and oversized input can leave gaps. Bootstrap looks back at most the retention window. Redis persistence/eviction configuration determines whether history and cursors survive Redis restarts. Losing cursors may trigger a broader retained-log replay; losing both source logs and Redis history cannot be repaired.
Credential-shaped keys, authorization strings, URL credentials, and recognized nested locals are redacted before retention. Redaction is best effort: secrets in arbitrary exception prose may remain. Stored data is escaped when rendered; it is never treated as HTML. Collector failures are reported through shared status, rather than logging captured error diagnostics back into their own feed.
The page distinguishes disabled collection (configuration or missing Redis/Docker), degraded collection (source/Redis failure, stale status, source cap), empty history, and expired detail. For degraded collection, check Redis connectivity, the Docker socket proxy, container logging drivers, and source limits. Sources retry without blocking requests. A running state indicates current collection health; it does not certify that Docker's historical logs are complete.
Run the isolated real Docker/Redis scenario from a generated project with Redis and deploy installed:
AEGIS_ERROR_TRACKING_DOCKER_TEST=1 uv run pytest tests/components/test_error_tracking_integration.py -q
It uses unique Redis namespaces and disposable source containers, verifies closed-browser collection, grouping, exact traces, replay, failover and container replacement, and removes its containers and keys afterward. The Redis contract and SSE tests run only against a Redis you name, never the development stack's, each in its own namespace:
docker run --rm -d -p 6390:6379 --name error-test-redis redis
AEGIS_ERROR_TRACKING_REDIS_URL=redis://127.0.0.1:6390 uv run pytest tests/services/test_error_store.py -q
How a line names its service
Keep using from app.core.log import logger. The shared logging processor derives
app_service from who owns the code (app.core.ownership.owner): a file under
app/services/<name>/, a route under app/components/backend/api/<name>/ (by its
name, or the one service it imports), or a service's CLI, only when the name belongs
to the shared ServiceName registry, checked against the generator’s ServiceSpec
list; runtime-registered plugin services are also accepted. Shared folders such as
system and change_queue are not application services. A line or exception from
a component's own code also names it as app_component (app/components/<name>/,
or a core client such as app/core/cache.py by the component it fronts).
Existing logger calls need no per-function context manager. emitting_service
records the service that wrote the log. For exceptions, the processor inspects
traceback frames and chained causes before formatting, allowing an AI failure
logged by an HTTP handler to retain its AI origin. Suppressed exception contexts
are not used. This is code-location attribution, not proof of the underlying
system responsible for a failure.
Scheduled job discovery retains the declaring service. The existing execution
wrappers establish scoped ownership automatically on scheduler and worker runs,
restore it after completion/failure, and preserve exception ownership for outer
handlers. Every process sets the same logging pipeline up as it boots
(apply_saved_overrides), workers started by their own CLI included. Arbitrary
process/thread handoffs outside those wrappers do not automatically inherit it.
Both development console logs and production JSON logs carry attribution into
retained errors. The runtime service and container identity remain separate
from app_service. The Errors checklist is the Logs one, with the same query
parameters (service, container, app_service, app_component), so a filter
carries between the two pages. Grouping includes the application service, never
the component, so naming components regrouped no existing issue.